

 Roll over image to zoom in
3D Resin Strength Data - FlashForge Standard Photopolymer Resin
Compression Strength Testing Results Welcome to our downloadable product for compression strength testing data for 3D resin. This product contains valuable information for those in the 3D printing industry who...
$3.99
SKU:
3D-DataSheet-FlashForge-StandardBlack
Categories:
Tags:
Compression Strength Testing Results
Welcome to our downloadable product for compression strength testing data for 3D resin. This product contains valuable information for those in the 3D printing industry who want to ensure the strength and durability of their resin-based prints. Our comprehensive testing data provides insights into the compression strength of various 3D resin materials, allowing you to make informed decisions about which resin to use for your specific application. By downloading this product, you will have access to reliable and accurate data that can help you improve the quality of your 3D printed parts and products.
Downloadable Files include:
Data
Below are the key points of our compression strength measurements (kgf) for 3D resin:
- We conducted 60 compression strength measurements for uncured resin.
- We conducted 60 compression strength measurements for cured resin with a 30-minute curing time.
- We conducted 31 sets of 5 compression strength measurements for resin that cured from raw (0 minutes) to 30 minutes, with 5 samples in each set.
Sample Results
Based on the results presented above, there are several ways you can utilize the data. For instance, you can compare the data with other brands/models to determine which resin is stronger. Additionally, we have provided sample tests and summary graphs for your convenience.The results presented below are for illustrative purposes only and should not be taken as the actual results you will obtain. These examples are included to give you an idea of the type of results you may expect from the downloadable files provided.
One of the statistics we have included compares the raw and cured data. From a sample test, we observed that the cured group had a mean strength of 75.197 kgf, while the uncured group had a mean strength of 59.368 kgf. This indicates that the curing process increased the strength by 27%.

The second point we'd like to highlight is the comparison graph of raw and cured resin. This plot is based on data sets 1 and 2, with the Y-axis representing strength (higher values indicate greater strength), and the X-axis representing the sample sequence. It's important to note that the sample sequence is not paired - for instance, sample number 5 in the raw resin group has no correlation to sample number 5 in the cured group.
From the graph, we can observe that cured resin (represented by open circles) generally exhibits higher strength compared to the uncured ones.

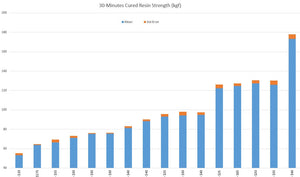
Our third point highlights the effect of curing time on the strength of 3D resin, as depicted in a graph based on data set 3. We conducted curing at one-minute intervals from 0 to 30 minutes, with five samples collected for each time interval.
Upon visual inspection, we can deduce that resin needs to be cured for a minimum of 15 minutes to achieve optimal strength. The data can be further analyzed using statistical methods such as nonlinear regression using Weibull model.

Here are some additional details about the testing methodology:
- The strength test unit used was kgf.
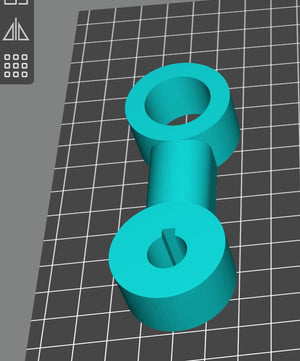
- The samples used in the tests were square-shaped, measuring 20 mm by 200 mm, with a thickness of 1 mm.
- We conducted the tests using a digital push-pull meter.
- For more information about the testing setup, please refer to the video provided below.
Data from the Manufacture

Related products


Add your product to the cart to view shipping rates. We've delivered to 289,762 customers in 149 countries.

Sign up for our newsletter to get weekly coupons and tips on printer refills and repairs.
Got a question? Don't hesitate to email us at support@bchtechnologies.com
Subscribe to Kevin's YouTube channel for the latest tips on printer repair and maintenance.
Recently viewed


VERY VERY SUPER PRODUCT. I purchased this product from Kevin and I can always say that Kevin is the best. Kevin definitely creates the best videos on the web. He has the best products and I always buy from him. Kevin also always recommends the best methods. I always recommend buying BCH TECHNOLOGIES products to always have perfect printers.
Alessandro R.
Instruction Sheet for L1800 / 1390 Printhead Testing with Multimeter (Digital Download) Instant Download — Delivered to Your Email
Best thing ever!! i used to put cleaning solution in the capping station with a syringe/hose then had to suck out f the wast line with a syringe.... over and over until the capping station was clean. maybe up to 10 times. now i just use maybe 1 or 2 - 30ml syringes full of water and the pump cleans it out so good.... then I put capping solution, place printhead over capping station and turn on the back of the machine. thats it. when i print again, usually next day, I pull from waste tank a few times until I get ink, then i run 1 head cleaning , print a test strip and usually good to go. I sometimes print a 2nd test strip. SO MUCH easier to use this little pump. so glad I bought it.
Ruth F.
TMS Printhead Maintenance System by BCH: Comprehensive Cleaning and Maintenance Solution
This is a must have modification to save time troubleshooting. You will need to download Kevin's capping station video to disassemble the capping station. A definite must. You will also need a few other connections to hook this up. All parts are linked in his videos. Pro tip. Have patience and go slow. This modification will save you from a lot of headaches . I did this mod on Procolored L1800 about a year old . Thanks Kevin.
Vincent K.
Waste Ink Collection Tank Combo with Small Tube for Epson (AS-EP-WASTE-25MM)